Glacier Mapping
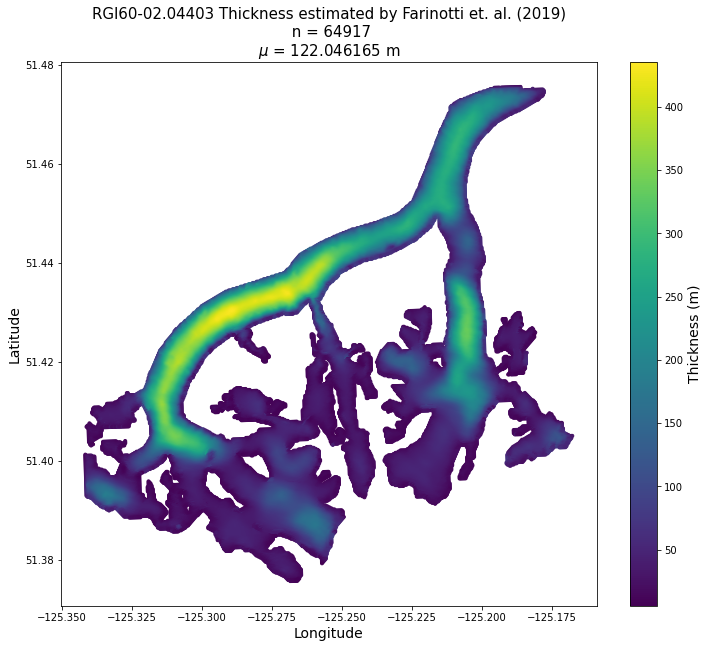
Farinotti et al. 2019 produced thickness maps for glaciers contained in the Randolph Glacier Inventory, a.k.a. RGI. This notebook projects and plots the thickness map into a readable image.

file_name = 'RGI60-02.04403_thickness.tif'
import rasterio as rio
import numpy as np
with rio.open(file_name) as src:
            thickness = src.read(1)
            height = thickness.shape[0]
            width = thickness.shape[1]
            cols, rows = np.meshgrid(np.arange(width), np.arange(height))
            xs, ys = rio.transform.xy(src.transform, rows, cols)
            lons= np.array(xs)
            lats = np.array(ys)
thickness[thickness == 0] = 'nan'
from pyproj import Transformer
transformer = Transformer.from_crs("WGS 84 / UTM zone 10N", "EPSG:4326")
lons, lats = transformer.transform(lons,lats)
# something gets scrambled here, reassign lat/lon
long = lats
lat = lons
import matplotlib.pyplot as plt
fig = plt.figure(figsize = (12,10))
fig.patch.set_color('w')
plt.scatter(long, lat, marker = '.',
            c = thickness, cmap = 'viridis',
           )
fig.patch.set_color('w')
cb = plt.colorbar()
cb.set_label(label='Thickness (m)',size = 14)
plt.ylabel('Latitude',fontsize = 14)
plt.xlabel('Longitude',fontsize = 14)
plt.title('RGI60-02.04403 Thickness estimated by Farinotti et. al. (2019)\n n = ' +
          str(len(np.unique(thickness[~np.isnan(thickness)]).flatten()))+'\n' +
          '$\mu$ = ' + str(np.mean(np.unique(thickness[~np.isnan(thickness)]))) + ' m',
          fontsize = 15)
